Temperature at Altitude Calculator
Intuitively, you'd say that the temperature decreases with altitude: our temperature at altitude calculator will only half-confirm this idea. The variation of temperature with altitude is a complex mechanism not entirely understood by climatologists yet.
In this article, we will guide you on a journey upward: you will learn how the temperature changes with altitude in the many layers of our gaseous blanket; we will give you the tools to understand this relationship, and answer the question, "is there an equation for the temperature at an altitude?", and, eventually, introduce you to the altitude-temperature chart.
We have another interesting tool called the open channel flow calculator that uses Manning's equation to find the properties of channel water flow. Be sure to check it and learn more!
The temperature of our atmosphere: introduction to the model of temperature change with altitude
Earth is a heated rock floating in the cold expanse of space, roughly million kilometers away from a big ball of incandescent plasma. These are the perfect basis for a complex model; trust us!
To study the change of temperature with altitude, it's good to know where we are studying it: Earth's atmosphere. Even though it looks infinitely high, with tall mountains barely piercing it and clouds lazily crossing it high above us, our atmosphere is a surprising and delicate gift (that we, as a species, are mistreating). With a height between and , it would take barely more than an hour to cross it on a highway.
In these 100-something kilometers, we can identify some markedly distinct layers where temperature behaves differently (it can also be the other way round, with temperature identifying the layers). Let's see how.
The variation of temperature with altitude: ISA temperature calculator
To calculate the temperature at an altitude, we can use the concept of geopotential height, a "gravity-corrected" model for the height of a point on Earth that considers the not-so-subtle variations in the acceleration due to gravity on our planet to create a more fitting models in meteorology and climatology. The model is called ISA, from International Standard Atmosphere.
However, these corrections are marginals to understand the behavior of temperature at different altitudes. Let's dive straight into the blue!
We will analyze the altitude-temperature chart almost as you can see it on our temperature at an altitude calculator:
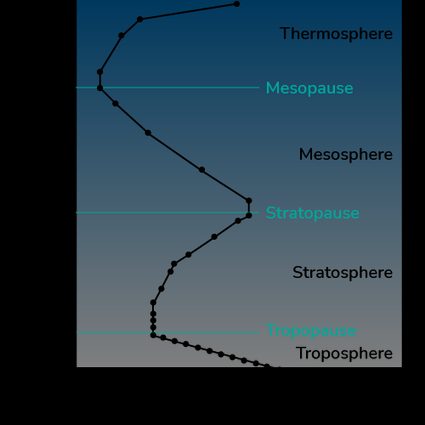
Let's start from the bottom. At sea level, our Planet has a mildly cold average temperature of . For temperate regions we can reach a pleasant . This is our starting point.
- From sea level to around we find the troposphere. Here, all living businesses take place: too high, and only some freaky bacteria venture higher than this. The current altitude record for an animal belongs to a Rüppell's vulture: the bird flew at but didn't enjoy the fame for long since the measurement was taken by means of "collision with an aircraft". In the troposphere the **temperature decreases by per km.
Earth's surface heats the tropopause: that's why it cools down with an increasing altitude.
- At the end of the troposphere, we find a region of constant temperature. The tropopause, found at about has a chilly temperature of . That's an interesting temperature for chemists to use the freezing point depression formula.
- Above the tropopause, the effect of the solar radiation becomes predominant. The variation of temperature with altitude takes an unexpected twist, and we witness an increase in air temperature by altitude. The ISA temperature calculates that for each kilometer in the stratosphere, the temperature increases by a value between and . You can clearly see this inversion on the temperature-altitude chart. An increased absorption of UV radiation explains this behavior by ozone moleculesat a height of about the story changes.
- At ~ we find the stratopause. We are almost in space! Here the change in temperature with altitude is negligible. For a short while, we are stable at about .
- After the stratopause, the temperature begins to drop again. With a gradient of about / per kilometer, the mesosphere sees the lowest temperatures of Earth's atmosphere. The temperature stops decreasing at about .
- Here, we find the mesopause. The temperature at above sea level is between and .
- Above the mesopause, we find the thermosphere. From about to almost , this is space already, and here we find most satellites orbiting Earth. The remaining air molecules in the thermosphere absorb an impressive amount of radiation, heating to . This incredibly high temperature is mostly kinetic, and the low density of the gas makes it possible for satellites and astronauts to be (mostly) fine at those heights.
- Lastly, we find the exosphere. This region has no upper boundary and simply fades into space (poetic). Its temperature is not well defined.
🙋 Input the desired starting temperature in our temperature at altitude calculator and find the corresponding altitude-temperature chart. You can also insert a specific altitude to obtain the numeric value!
Is there an equation for the altitude-temperature of air relationship?
Yes, and no. While a single, good-looking equation for the temperature at different altitudes is nowhere to be found, we can "patch together" the behaviors at different altitudes to create a mathematical description of the air temperature by altitude: Our altitude-to-temperature calculator does precisely this!
